Friday, June 15, 2012
Mobile App Index: 61.33 (2.42)% WE 6/15/12
Predictions were correct on both counts: it was a less than 3.2% drop for the index and the major indices did not climb as high as last week. But the loss for the MobiAppIndex was rather mixed -- 5 stocks gained, while 5 lost this week. COOL announced earnings this week and proceeded to consistently decline towards the end of the week. AUGT announced some sort of 'pre-earnings' update on Tuesday, which prompted a continuous decline following. Lastly P declined after an analyst report about a competing service gained some buzz from their latest iPhone offering on Tuesday or Wed -- it is back on the upswing again now. There is a fickle nature to these stocks as the slightest indication of economic troubles in Europe as we saw on Monday will trigger a quick, steep slide. MITK turned in its second week as the biggest winner, and has gained 48% in that time. Now that earnings have completed for a while, with the possible exception of a 7/10 11am ET update from AUGT, I predict that the volatility will continue to slow for the index and I expect it to go up less than 1%. For the major indices, I think that the Euro crisis will continue to simmer on low and expect that it will go very slightly upwards or experience a slight decline of less than 0.5%.
Winners: MITK +23.01%, GLUU +4.71%, VELT +2.94%
Losers: COOL (20.48)%, NCTY (10.62)%, AUGT (9.9)%, ROVI (9.7%), P (3.08)%
Comparison: DJI +1.7%, Nasdaq +0.5%, S&P 500 +1.3%, EEM +2.85%, FONE +0.27%
Upcoming earnings: AUGT 7/10 11am ET
Friday, June 8, 2012
Mobile App Index: 62.85 +2.41% WE 6/8/12
The Mobile Application Index gained as predicted, but not as far as the major indices, which appeared to have bounced off of its' bottom on Monday. The big winner this week was MITK +20.71% which appears to maintain a very high degree of weekly volatility over the past month by flipping between $2 to $2.40 per share. I do not think that the major indices will climb as greatly next week and I expect that the MobiAppIndex will continue to slow its' volatility -- next week will be a slight gain or less than a 3.2% drop. As new products continue to roll out for Android over the next few months there may be an associated increase in interest in the stocks in this index.
Upcoming earnings: COOL 6/11
Comparison: DJI +3.58%, Nasdaq +4.04%, S&P 500 +3.73%, EEM +3.35%, FONE +3.31%
Winners: MITK +20.71%, NCTY +12.52%, P +10.94%, EPOC +10.05%, GLUU +4.45%, COBR +1.82%
Losers: AUGT (8.18)%, VELT (4.43)%, COOL (0.94)%
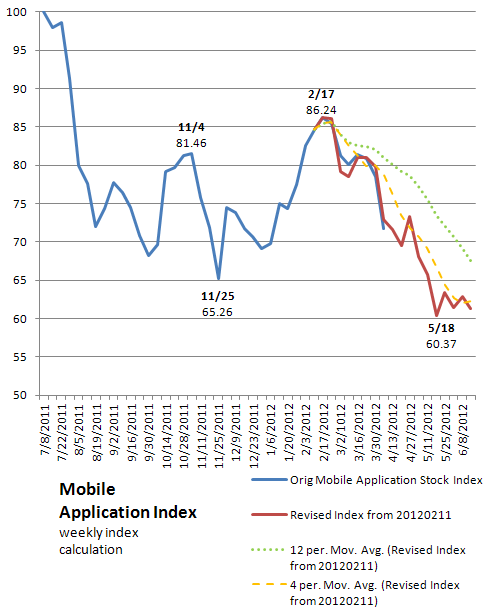
NOTE: the trendlines have been updated to reference the Feb (RED) line.
Upcoming earnings: COOL 6/11
Comparison: DJI +3.58%, Nasdaq +4.04%, S&P 500 +3.73%, EEM +3.35%, FONE +3.31%
Winners: MITK +20.71%, NCTY +12.52%, P +10.94%, EPOC +10.05%, GLUU +4.45%, COBR +1.82%
Losers: AUGT (8.18)%, VELT (4.43)%, COOL (0.94)%
NOTE: the trendlines have been updated to reference the Feb (RED) line.
Friday, June 1, 2012
Mobile App Index: 61.37 (3.19)% WE 6/1/12
It appears that the major indices are very close to a potential technical bottom -- they are at close to zero gains from 10/31/11 (DJI -0.92%, Nasdaq +0.38%, and S&P500 -0.55%). We can once again thank the European debt crisis and also thank the poor jobs report kicker on Friday for this development. Based on this, I'd expect the Mobile Application Index to start moving upwards in a consistent trend -- hopefully an upwards trend about as long as the downwards trend. Prediction: the Mobile Application Index gains next week.
The Mobile Application Index experienced a broad decline this week but not as sharp as in prior weeks, and not as sharp as you'd expect when compared to the major indices, so this indicates support for them. The big gainers from last week were the big losers this week.
Winners: NCTY +17.11%, AUGT +5.26%, VOCS +5.15%, COOL +1.92%
Losers: MITK (16.18)%, P (15.52)%, GLUU (9.53)%, VELT (9.13)%, EPOC (8.46)%, ROVI (6.79)%, COBR (1.12)%
Comparison: DJI (2.02)%, Nasdaq (1.12)%, S&P 500 (1.33)%, EEM (1.63)%, FONE (2.54)%
The Mobile Application Index experienced a broad decline this week but not as sharp as in prior weeks, and not as sharp as you'd expect when compared to the major indices, so this indicates support for them. The big gainers from last week were the big losers this week.
Winners: NCTY +17.11%, AUGT +5.26%, VOCS +5.15%, COOL +1.92%
Losers: MITK (16.18)%, P (15.52)%, GLUU (9.53)%, VELT (9.13)%, EPOC (8.46)%, ROVI (6.79)%, COBR (1.12)%
Comparison: DJI (2.02)%, Nasdaq (1.12)%, S&P 500 (1.33)%, EEM (1.63)%, FONE (2.54)%
Saturday, May 26, 2012
Mobile App Index: 63.39 +5.01% WE 5/25/12
The downward momentum was checked this week -- the Mobile Application Index bounced and the major indices were mixed -- but overall the across-the-board rapid declines of recent weeks have slowed. While I cannot predict exactly what will happen with the major indices next week, they may rise, it still appears that their 'bottom' has not been found yet (see below for more details as I attempt to more completely answer the question from this week). As for the overall comparison indices, I believe that this weeks' performance of the MobiAppIndex indicates that they will begin to return to a positive trend in the next month -- but I predict that there will be another week or so of declines in the major indices before then.
P announced earnings and, as predicted, it did not disappoint -- it wildly exceeded my expectations. MITK surprised us this week with a very strong return on no news -- maybe the 80% overall decline was an over correction? The overall increase in the index this week was extremely broad, and indicates to me that it will return to a positive trend soon -- the only loser was NCTY. The theory is that the MobiAppIndex will lead the major indices during the upward trend.
Winners: P +20.68%, MITK +17.82%, GLUU +14.56%, VELT +10.21%, COOL +4.52%, EPOC +2.81%, ROVI +2.4%
Losers: NCTY (6.25)%
Comparison: DJI +0.69%, Nasdaq +2.1%, S&P 500 +1.74%, EEM (0.38)%, FONE (0.33)%
Rebalancing candidates: Millenial Media (MM on NYSE) -- a new IPO, and Vringo (VRNG on AMEX) -- has gone above $2.00/share again. More on a rebalancing update in a month or so.
To finish answering last weeks' question of "How will the markets, and therefore the Mobile Application Index, recover from the recent steep declines?" there are a couple more observations to make. I will list them out in the form of facts/assumptions, and encourage the reader to review past postings for more details and also separately validate them. Nobody has the complete picture when it comes to investing, but the idea is to either become educated enough about your investments to make a good decision, have some sort of "insider information" (illegal), or intelligent algorithm/technology to make the investment work. In the case of the Mobile Application Index, the investing idea here is to utilize an algorithm that takes an ETF-like approach wherein a 'buy and hold' strategy could work.
Here is the Mobile Application Index algorithm (it is very simple):
1) Rebalance the index at least once a year -- preferrably once every six months at least (after an earnings period.)
2) Current weightings are: 40% of the index dedicated to 'unique' application stocks, 30% to gaming and entertainment, and 30% to marketing stocks,
3) Select only stocks that can clearly demonstrate a key component of their business strategy depends upon the mobile application space (software not hardware) -- smartphones and tablets -- whose current price per share is greater than or equal to $2.00 USD. NOTE: my preference is to utilize only shares that trade over NYSE, AMEX or Nasdaq, but that is not a hard requirement.
Disclosure: I currently hold positions in every stock in the index except three in the gaming and entertainment category: ROVI, NCTY and COOL. My sense on this has been that gaming is 'over invested' relative to the rest of the index -- many companies in the gaming industry are not publicly traded -- and the likelihood of a strong success is therefore more limited. I also try to 'time' my purchases in an opportunistic way, rather than do wholesale buying and selling when I 'rebalance' the portfolio. Example: I bought more MITK earlier in the week.
As for how will the MobiApp and major indices rebound, here is my list:
1) The smartphone market is very large and growing -- a 47% year on year growth so far in 2012. You can easily find articles on this:
http://mobithinking.com/mobile-marketing-tools/latest-mobile-stats
http://www.siliconrepublic.com/digital-life/item/27255-mobile-phone-sales-decline/
2) The tablet market is "on fire" -- 124% year on year growth so far in 2012
http://www.siliconrepublic.com/digital-life/item/27255-mobile-phone-sales-decline/
3) The overall major indices are still in recovery mode from 2008
4) The mobile applications that consumers use actually define the value of the smartphone and the tablet for them
5) While the individual stocks vary in their revenue growth rates, in general those rates move as a function of the overall smartphone and tablet market. In short, the market itself is growing very fast and in order for a company to maintain its' foothold (retain or grow marketshare) they must continually invest rapidly in product innovations, people resources, infrastructure and marketing and sales. This "mach 2 with your hair on fire" situation becomes the key to both the investment opportunity and the stressful anguish that we're seeing -- the investment community wants profitable companies and we're in an investment climate where 'taking profit on volatility' has become a critical investment strategy for many hedge funds. We cannot expect many of these companies to be profitable at this point in the markets' lifecycle -- to do so could become the reason for slowed growth.
So how does the MobiAppIndex 'return' to last years levels and go beyond that? With each successive earnings report, these companies need to continue to demonstrate:
1) their markets are growing and they are maintaining their marketshare or their marketshare is growing
2) their revenues are growing in kind with the overall smartphone and tablet growth -- or there are serious and credible plans to get there
3) ideally they should show that their losses are consistently declining and there is a 'light at the end of the tunnel' for profitability.
As for the major indices, I have no idea what will fix those problems -- I just use them as a relative comparison -- but I think it still has something to do with the politics behind the 'credit default swap' crisis of 2008.
P announced earnings and, as predicted, it did not disappoint -- it wildly exceeded my expectations. MITK surprised us this week with a very strong return on no news -- maybe the 80% overall decline was an over correction? The overall increase in the index this week was extremely broad, and indicates to me that it will return to a positive trend soon -- the only loser was NCTY. The theory is that the MobiAppIndex will lead the major indices during the upward trend.
Winners: P +20.68%, MITK +17.82%, GLUU +14.56%, VELT +10.21%, COOL +4.52%, EPOC +2.81%, ROVI +2.4%
Losers: NCTY (6.25)%
Comparison: DJI +0.69%, Nasdaq +2.1%, S&P 500 +1.74%, EEM (0.38)%, FONE (0.33)%
Rebalancing candidates: Millenial Media (MM on NYSE) -- a new IPO, and Vringo (VRNG on AMEX) -- has gone above $2.00/share again. More on a rebalancing update in a month or so.
To finish answering last weeks' question of "How will the markets, and therefore the Mobile Application Index, recover from the recent steep declines?" there are a couple more observations to make. I will list them out in the form of facts/assumptions, and encourage the reader to review past postings for more details and also separately validate them. Nobody has the complete picture when it comes to investing, but the idea is to either become educated enough about your investments to make a good decision, have some sort of "insider information" (illegal), or intelligent algorithm/technology to make the investment work. In the case of the Mobile Application Index, the investing idea here is to utilize an algorithm that takes an ETF-like approach wherein a 'buy and hold' strategy could work.
Here is the Mobile Application Index algorithm (it is very simple):
1) Rebalance the index at least once a year -- preferrably once every six months at least (after an earnings period.)
2) Current weightings are: 40% of the index dedicated to 'unique' application stocks, 30% to gaming and entertainment, and 30% to marketing stocks,
3) Select only stocks that can clearly demonstrate a key component of their business strategy depends upon the mobile application space (software not hardware) -- smartphones and tablets -- whose current price per share is greater than or equal to $2.00 USD. NOTE: my preference is to utilize only shares that trade over NYSE, AMEX or Nasdaq, but that is not a hard requirement.
Disclosure: I currently hold positions in every stock in the index except three in the gaming and entertainment category: ROVI, NCTY and COOL. My sense on this has been that gaming is 'over invested' relative to the rest of the index -- many companies in the gaming industry are not publicly traded -- and the likelihood of a strong success is therefore more limited. I also try to 'time' my purchases in an opportunistic way, rather than do wholesale buying and selling when I 'rebalance' the portfolio. Example: I bought more MITK earlier in the week.
As for how will the MobiApp and major indices rebound, here is my list:
1) The smartphone market is very large and growing -- a 47% year on year growth so far in 2012. You can easily find articles on this:
http://mobithinking.com/mobile-marketing-tools/latest-mobile-stats
http://www.siliconrepublic.com/digital-life/item/27255-mobile-phone-sales-decline/
2) The tablet market is "on fire" -- 124% year on year growth so far in 2012
http://www.siliconrepublic.com/digital-life/item/27255-mobile-phone-sales-decline/
3) The overall major indices are still in recovery mode from 2008
4) The mobile applications that consumers use actually define the value of the smartphone and the tablet for them
5) While the individual stocks vary in their revenue growth rates, in general those rates move as a function of the overall smartphone and tablet market. In short, the market itself is growing very fast and in order for a company to maintain its' foothold (retain or grow marketshare) they must continually invest rapidly in product innovations, people resources, infrastructure and marketing and sales. This "mach 2 with your hair on fire" situation becomes the key to both the investment opportunity and the stressful anguish that we're seeing -- the investment community wants profitable companies and we're in an investment climate where 'taking profit on volatility' has become a critical investment strategy for many hedge funds. We cannot expect many of these companies to be profitable at this point in the markets' lifecycle -- to do so could become the reason for slowed growth.
So how does the MobiAppIndex 'return' to last years levels and go beyond that? With each successive earnings report, these companies need to continue to demonstrate:
1) their markets are growing and they are maintaining their marketshare or their marketshare is growing
2) their revenues are growing in kind with the overall smartphone and tablet growth -- or there are serious and credible plans to get there
3) ideally they should show that their losses are consistently declining and there is a 'light at the end of the tunnel' for profitability.
As for the major indices, I have no idea what will fix those problems -- I just use them as a relative comparison -- but I think it still has something to do with the politics behind the 'credit default swap' crisis of 2008.
Friday, May 18, 2012
Mobile App Index: 60.37 (8.17)% WE 5/18/12
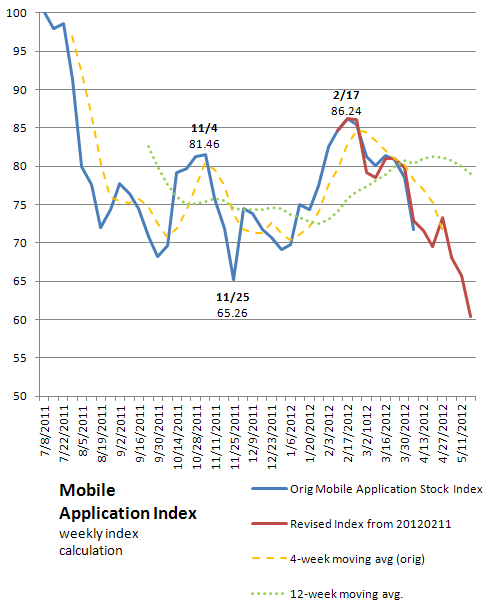
Last weeks' prediction was easily achieved, and the major indices went with it by getting very close to a sideways state this week. In the past 6 months or so since 11/17/2011 the DJI is up only 3.89%, Nasdaq 5.26%, and the S&P500 is up 4.48% and since that fateful time period of 4/3/2012 they have declined 6.75%, 10.92% and 8.73% respectively. By comparison, the Mobile Application Index is down 16% since 11/18/2011 and 17% since 4/6/2012, and it is down 30% from its' high on 2/17/2012. I don't think that the major indices have hit their bottom point yet, but I am not sure about the Mobile Application Index. Earnings season for the index is almost complete, but neither COOL nor NCTY have announced their earnings or a date they intend to report them. Coming up P, whose earnings I expect will not be received negatively -- it was the biggest winner this week.
VELT declined 25.71% after its' earnings announcement despite showing an increase in revenues and profitability. The only explanation I could find indicated that decreased cash on-hand was the reason. But the biggest loser this week was MITK as it declined 26.81% this past week (there is no news to be found about the stock this week) and now down 87% since 3/30 when it traded at $11.60 -- it closed today at $2.02.
Winners: P 5.51%, EPOC 2.49%
Losers: MITK (26.81)%, VELT (25.71)%, NCTY (16.96)%, VOCS (10.88)%, COOL (8.72)%, GLUU (7.21)%, ROVI (6.53)%, AUGT (3.26)%, COBR (3.1)%
Comparison: DJI (3.52)%, Nasdaq (5.28)%, S&P (4.29)%, EEM (6.67)%, FONE (5.24)%
Earnings: P 5/23 5pm ET
VELT declined 25.71% after its' earnings announcement despite showing an increase in revenues and profitability. The only explanation I could find indicated that decreased cash on-hand was the reason. But the biggest loser this week was MITK as it declined 26.81% this past week (there is no news to be found about the stock this week) and now down 87% since 3/30 when it traded at $11.60 -- it closed today at $2.02.
Winners: P 5.51%, EPOC 2.49%
Losers: MITK (26.81)%, VELT (25.71)%, NCTY (16.96)%, VOCS (10.88)%, COOL (8.72)%, GLUU (7.21)%, ROVI (6.53)%, AUGT (3.26)%, COBR (3.1)%
Comparison: DJI (3.52)%, Nasdaq (5.28)%, S&P (4.29)%, EEM (6.67)%, FONE (5.24)%
Earnings: P 5/23 5pm ET
Saturday, May 12, 2012
Mobile App Index: 65.74 (3.41)% WE 5/11/12
One could argue at this point that the Mobile Application Index has gone sideways since the end of October 2011. Will the other major indices follow? It would appear so -- as their downward trend began at the beginning of April. With news about another chapter in the book of financial gambling failures to the tune of $1B then $2B and possibly $3B (sound familiar?) -- including the 9.3% loss of market cap this is ultimately a $17B decline -- from the likes of JPMorgan Chase combined with the Merkozi "divorce," :-) the unrest in European countries like Greece, it appears that progress remains somewhat inconsistent. The decline of the index did slow this week, but not as much as expected. Since we are so close, my prediction is that we will set a new low for the Mobile Application Index next week.
Forbes on the JP Morgan blunder (this links to the article) emphasis added:
"In any case, by late March, people started getting antsy about the economy and the index jumped — making the hedge funds happy. According to the Times, JPMorgan’s first quarter losses were not big enough to make the bank acknowledge the criticism but thanks to media coverage, the index spiked — and so did JPMorgan’s potential insurance claims if the companies in the index went bankrupt.
This matters because JPMorgan has been fighting the sort of regulation that would block such reckless gambles. Ultimately, people who deposit money in a bank want the money kept safe. And as long as the government has enough money to cover all the losses from a collapsed banking system, FDIC insurance protects depositors in the event that bets like JPMorgan’s send a bank down the tubes.
But what caused JPMorgan to lose money was its highly speculative trade against hedge funds that was being made artificially profitable by using JPMorgan’s capital — your deposits — to push down the price of insurance below the so-called free market rate.
Given the $23.7 trillion in cash and guarantees used to bail out financial institutions in 2008, depositors and taxpayers have good reason to question the kind of “free market” that Wall Street’s $5 billion in Washington campaign contributions and lobbying fees has bought."
This past week P did not announce earnings -- that will be on 5.23. AUGT did announce earnings, which were received negatively. VELT is coming up next ...
Winners: EPOC 6.27%, GLUU 5.97%, P 5.83%, VOCS 5.19%
Losers: VELT (20.11)%, AUGT (7.73)%, COBR (4.44)%, COOL (3.54)%, NCTY (2.36)%, ROVI (2.01)%
Comparison: DJI (1.67)%, Nasdaq (0.76)%, S&P 500 (1.14)%, EEM (3.35)%, FONE (1.75)%
Earnings: VELT 5/15 4:30pm ET, P 5/23 5pm ET
Forbes on the JP Morgan blunder (this links to the article) emphasis added:
"In any case, by late March, people started getting antsy about the economy and the index jumped — making the hedge funds happy. According to the Times, JPMorgan’s first quarter losses were not big enough to make the bank acknowledge the criticism but thanks to media coverage, the index spiked — and so did JPMorgan’s potential insurance claims if the companies in the index went bankrupt.
This matters because JPMorgan has been fighting the sort of regulation that would block such reckless gambles. Ultimately, people who deposit money in a bank want the money kept safe. And as long as the government has enough money to cover all the losses from a collapsed banking system, FDIC insurance protects depositors in the event that bets like JPMorgan’s send a bank down the tubes.
But what caused JPMorgan to lose money was its highly speculative trade against hedge funds that was being made artificially profitable by using JPMorgan’s capital — your deposits — to push down the price of insurance below the so-called free market rate.
Given the $23.7 trillion in cash and guarantees used to bail out financial institutions in 2008, depositors and taxpayers have good reason to question the kind of “free market” that Wall Street’s $5 billion in Washington campaign contributions and lobbying fees has bought."
This past week P did not announce earnings -- that will be on 5.23. AUGT did announce earnings, which were received negatively. VELT is coming up next ...
Winners: EPOC 6.27%, GLUU 5.97%, P 5.83%, VOCS 5.19%
Losers: VELT (20.11)%, AUGT (7.73)%, COBR (4.44)%, COOL (3.54)%, NCTY (2.36)%, ROVI (2.01)%
Comparison: DJI (1.67)%, Nasdaq (0.76)%, S&P 500 (1.14)%, EEM (3.35)%, FONE (1.75)%
Earnings: VELT 5/15 4:30pm ET, P 5/23 5pm ET
Sunday, May 6, 2012
Mobile App Index: 68.06 (7.18)% WE 5/4/12
Volatility indeed! Aaannd ... my prediction was wrong. :-) Again. MITK plummeted 53.8% after earnings, which brings the 'darling stock' down around 81% over the past 5-weeks. EPOC dropped 12.65% despite producing fairly positive numbers. VOCS announced earnings, but the announcement was not published until shortly beforehand -- a positive double surprise by yielding a 20% gain. It was a major decline all the way around and gleaning sense merely from the index activity remains challenging, except to say that it is intimately bound to the behavior of the major world indices. That 'effect' hit the hardest this week since 12/16/11, but appears to be more like what we experienced at the end of November 2011 -- there may be more declines to come. In short, these tiny stocks appear to mean little when compared to the larger indices, but I stick by my theory that it can serve as a leading indicator. Having said that, I think that the index will head towards positive territory this coming week -- relatively speaking against the indices or absolutely. Like me, I believe that the market *wants* to be optimistic, but the going is still quite challenging.
Upcoming earnings: AUGT 5/8 11am ET, P 5/8 11:35am EST, VELT 5/15 4:30pm ET
Winners: VOCS +20.14%, AUGT +1.3%
Losers: MITK (53.8)%, EPOC (12.65)%, ROVI (8.2)%, GLUU (7.3)%, COOL (7)%, COBR (4.06)%, NCTY (3.58)%
Comparison: DJI (1.43)%, Nasdaq (3.68)%, S&P 500 (2.43)%, EEM (2.27)%, FONE (3.89)%
Upcoming earnings: AUGT 5/8 11am ET, P 5/8 11:35am EST, VELT 5/15 4:30pm ET
Winners: VOCS +20.14%, AUGT +1.3%
Losers: MITK (53.8)%, EPOC (12.65)%, ROVI (8.2)%, GLUU (7.3)%, COOL (7)%, COBR (4.06)%, NCTY (3.58)%
Comparison: DJI (1.43)%, Nasdaq (3.68)%, S&P 500 (2.43)%, EEM (2.27)%, FONE (3.89)%
Subscribe to:
Posts (Atom)